
Highlights
Spring break and sporting events driving U.S. results
U.S. RevPAR growth strong Sunday through Thursday
ADR driving gains globally
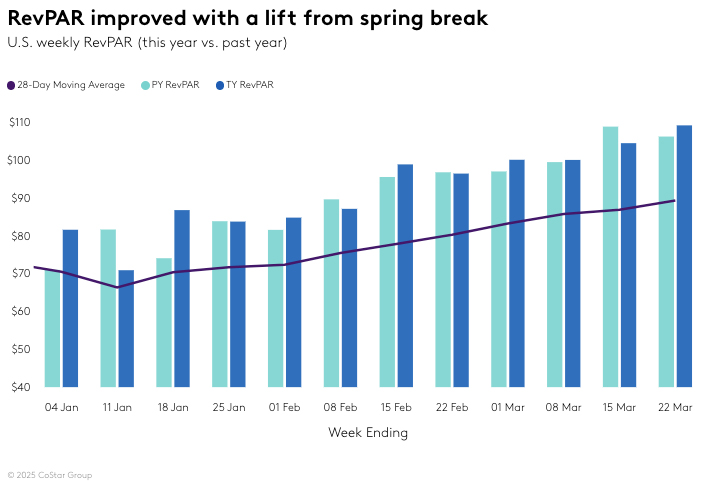
Spring arrived
U.S. hotel RevPAR improved as spring break propelled leisure travel. Revenue per available room (RevPAR) rose 2.8%, mostly on average daily rate (ADR), which increased 1.8%.
RevPAR gains were particularly strong Sunday through Thursday with the measure rising 5.6%, also on ADR growth (+3.7%). Sunday to Thursday RevPAR growth in non-Top 25 Markets was slightly better (+6.1% vs. +5.2%), but both groups saw weekend RevPAR retreat with the Top 25 Markets reporting the largest decrease (-5.5%).
As reported in last week’s analysis, this year’s spring break for K-12 students is later and elongated due to the shift of Easter and a later start to the school calendar after the winter holiday break. The percentage of students on spring break in the most recent week was the highest of the year according the STR’s School Break Report. The next largest percentage of students on break will occur in the week ending 19 April 2025, ahead of Easter. A year ago, the highest volume of K-12 spring breakers occurred in the week ending 30 March 2024, which was Easter week.
RevPAR growth was highest on Sunday (+9.8%) and moderated slowly to +2.9% on Thursday. Weekend (Friday/Saturday) RevPAR declined 2.8%. Both the Top 25 Markets and all others saw a similar pattern. In the full week (Sunday-Saturday), the Top 25 Markets trailed the rest of the U.S. in RevPAR growth (+1.8% vs.+3.8%) due to the sharper weekend RevPAR decrease.
Across the Top 25 Markets, only eight markets saw RevPAR above the Top 25 average of +1.8%. However, two markets, Chicago and Anaheim (Orange County), saw RevPAR growth soar more than 20%. Chicago hosted the ProMat 2025 conference and Orange County welcomed the American Physical Society conference.
Three other Top 25 Markets posted double-digit RevPAR gains – Minneapolis, Tampa and Philadelphia. In Minneapolis, the central business district and Bloomington saw solid growth due to the Northern Light Volleyball Qualifier. Tampa was lifted by submarkets surrounding the CBD that were propelled by spring breakers, and Philadelphia hosted the NCAA Wresting Tournament, which had the greatest impact on the Philadelphia stadium market and the CBD.
Washington, DC reported the largest decline this week due to the difficult comp to last year when Satellite 2024 was held. Frequently when a market experiences a large increase or decrease, it is generally due to an event shift in dates or location.
Additional market highlights included Houston with its continuation of the 23-day Houston Rodeo that ended 23 March. The market surrounding NRG Stadium (Houston Medical Center/NRG Stadium) recorded a 67.6% RevPAR increase. The first round of the Men’s and Women’s NCAA Basketball tournament helped host markets this year and hindered comps for last year’s hosts that did not repeat in 2025. Generally, the smaller markets see the largest gains. This week, the top markets were Milwaukee and Cleveland with weekend RevPAR gains of 58.2% and 42.3%, respectively.
Finally, spring break markets saw solid growth led by the Florida Panhandle, which saw the nation’s highest RevPAR gain this week (+28.3%). Occupancy was led by the Florida Keys (91.1%) and ADR by Maui ($466).
Luxury hotels continue strong performance, especially in markets outside the Top 25
Luxury hotels saw the largest RevPAR gain (+8.4%), lifted primarily by ADR. Markets outside the Top 25 advanced RevPAR at a faster pace than the Top 25 (+12.2% vs. +5.6%). Outside the Top 25, occupancy was the main driver. ADR lifted RevPAR for Luxury hotels in the Top 25 Markets.
Across the remaining chain scales, RevPAR increased at a more modest level ranging from +1.8% to 0% with ADR driving Upper Upscale, and to a lesser extent, Upscale hotels. Occupancy lifted the bottom three.
Upper Upscale hotels and Economy hotels followed the Luxury pattern seeing a greater performance lift outside the Top 25 Markets while the middle three chain scales posted greater RevPAR gains in the Top 25 Markets.
All chain scales followed the strong week and weaker weekend pattern seen nationally with the shoulder and weekdays showing solid RevPAR gains. Weekend RevPAR slowed across the board with only Luxury chains posting a positive RevPAR comp (+2.2%), while the other chains scales retreated, ranging from -2.9% (Midscale) to -4.2% (Upscale).


Group demand down for the third week in a row
Group demand in Luxury and Upper Upscale hotels decreased for the third consecutive week, down 6.6%, while ADR rose 4.9%. Transient demand advanced 5.5% with ADR increasing 2.8%.
The shifting performance across the chain scales is partially due to the segmentation shift, a result of spring break propelling leisure and slowing business. This shift is magnified across the Top 25 Markets, which reported an even greater group demand decline (-8.0%). Only 10 of the Top 25 Markets posted a group demand increase with Philadelphia and Detroit seeing the largest growth. Conversely, transient demand was up for both the Top 25 and the rest of the country. Transient ADR was flat for the Top 25, while the rest of the country saw a notable increase (+6.7%).


Other things we are watching
Hurricane-affected markets from 2024 continue to see elevated performance relative to the rest of the U.S. with RevPAR for the week up 9.1% and occupancy up 2.4 ppts. Augusta, with RevPAR up 24.8%, has consistently ranked at the top of the list of the 13 identified markets.
The three submarkets most impacted by January’s wildfires in California (Los Angeles East, Los Angeles West and Pasadena/Glendale/Burbank) continued to post strong RevPAR gains with this week’s results ranging from +20.5% (Pasadena/Glendale/ Burbank) to +6.5% (Los Angeles North).
Demand across hotels on both the Canadian and Mexico borders increased this week following three weeks of demand declines. Of the 1,306 hotels within 50 miles of the Canadian border, demand was up 1.3%. On the Mexican border, of the 916 hotels within 50 miles, demand was up 4.5%. As a comparison, U.S. demand was up 1.6%.
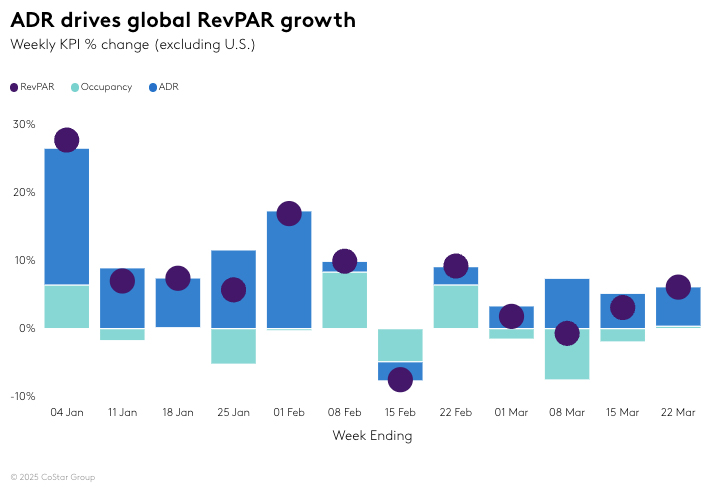
Global ADR continues full steam ahead
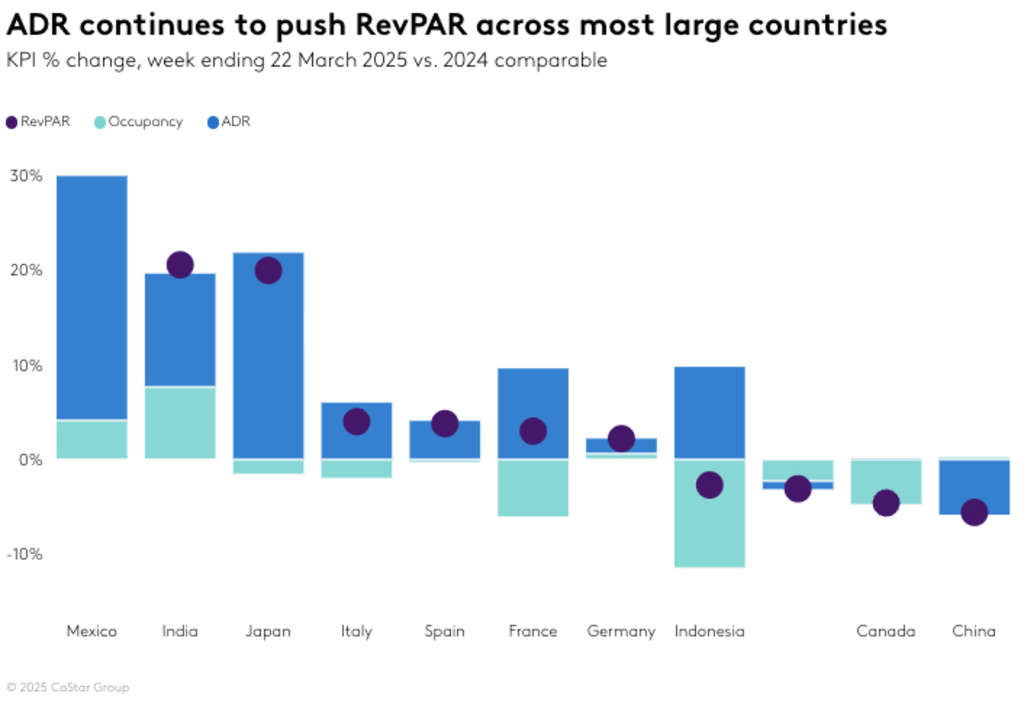
Globally, ADR continued a remarkable growth streak with year-over-year ADR gains in 58 of the past 60 weeks. This week was no exception with ADR rising 5.7%, producing a RevPAR gain of 6.3%. Most of the largest countries, based on supply, experienced RevPAR gains almost entirely due to ADR. Of the four posting negative RevPAR comps, occupancy drove the decline, except in China.

Mexico continued to see strong performance as it has since last fall. Baja California, Mexican Caribbean, Cancun, and Mexico City led the strong growth with 12 of the 14 markets posting RevPAR growth driven primarily by ADR.
India returned this week with strong RevPAR gains as 16 of its 17 markets reported increases. India also produced one of the only occupancy gains (5.4ppts) among the top countries.
The other country was Mexico (+2.3ppts). Japan holds an equally strong position next to India with ADR driving RevPAR growth. All 11 Japanese markets reported positive RevPAR change.
Canada and the United Kingdom, two countries with travel patterns that often reflect those of the U.S., both reported declining RevPAR due to decreases in occupancy.

Looking ahead
Next week will likely see strong results due to the easy comparisons as last year was the lead up to Easter. As a reminder, RevPAR fell that week by 6% on falling demand. Spring break holidays will continue to drive leisure travel until Easter 2025 but at a slower pace. Additionally, several parts of the country will see difficult comparisons in the days around Monday, 7 April due last year’s total solar eclipse that occurred on Monday, 8 April. U.S. results will be impacted as major markets were in the path of the eclipse. Following closely will be Easter week (week ending 18 April), which will suppress demand. Globally, performance in Europe and Central/South America is also expected to be impacted by the Easter calendar shift.


*Analysis by Isaac Collazo, Chris Klauda.
*All financial figures in U.S. dollar constant currency.
About CoStar Group, Inc.
CoStar Group (NASDAQ: CSGP) is a leading provider of online real estate marketplaces, information, and analytics in the property markets. Founded in 1987, CoStar Group conducts expansive, ongoing research to produce and maintain the largest and most comprehensive database of real estate information. CoStar is the global leader in commercial real estate information, analytics, and news, enabling clients to analyze, interpret and gain unmatched insight on property values, market conditions and availabilities. Apartments.com is the leading online marketplace for renters seeking great apartment homes, providing property managers and owners a proven platform for marketing their properties. LoopNet is the most heavily trafficked online commercial real estate marketplace with thirteen million average monthly global unique visitors. STR provides premium data benchmarking, analytics, and marketplace insights for the global hospitality industry. Ten-X offers a leading platform for conducting commercial real estate online auctions and negotiated bids. Homes.com is the fastest growing online residential marketplace that connects agents, buyers, and sellers. OnTheMarket is a leading residential property portal in the United Kingdom. BureauxLocaux is one of the largest specialized property portals for buying and leasing commercial real estate in France. Business Immo is France’s leading commercial real estate news service. Thomas Daily is Germany’s largest online data pool in the real estate industry. Belbex is the premier source of commercial space available to let and for sale in Spain. CoStar Group’s websites attracted over 163 million average monthly unique visitors in the third quarter of 2024. Headquartered in Washington, DC, CoStar Group maintains offices throughout the U.S., Europe, Canada, and Asia. From time to time, we plan to utilize our corporate website, CoStarGroup.com, as a channel of distribution for material company information. For more information, visit CoStarGroup.com.
This news release includes “forward-looking statements” including, without limitation, statements regarding CoStar’s expectations or beliefs regarding the future. These statements are based upon current beliefs and are subject to many risks and uncertainties that could cause actual results to differ materially from these statements. The following factors, among others, could cause or contribute to such differences: the risk that future media events will not sustain an increase in future occupancy rates. More information about potential factors that could cause results to differ materially from those anticipated in the forward-looking statements include, but are not limited to, those stated in CoStar’s filings from time to time with the Securities and Exchange Commission, including in CoStar’s Annual Report on Form 10-K for the year ended December 31, 2023 and Forms 10-Q for the quarterly periods ended March 31, 2024, June 30, 2024, and September 30, 2023, each of which is filed with the SEC, including in the “Risk Factors” section of those filings, as well as CoStar’s other filings with the SEC available at the SEC’s website (www.sec.gov). All forward-looking statements are based on information available to CoStar on the date hereof, and CoStar assumes no obligation to update or revise any forward-looking statements, whether as a result of new information, future events or otherwise.
View source